Hospital Service Line Profitability Analysis: Finding Out Where the Margin Actually Is
A CPA's guide to hospital service line profitability: contribution margin vs fully allocated cost, costing methods, and the cadence that makes it stick.



Key Takeaways
Hospital service line profitability analysis builds a profit and loss view for each clinical line, cardiology, orthopedics, women's health, oncology, so leadership can see which lines create margin and which consume it.
Judge a service line on contribution margin first. Closing a line because it "loses money" on a fully allocated P&L is the classic trap, because most allocated overhead does not leave when the line does; it lands on the survivors.
Ratio of cost to charges (RCC) costing is usually good enough to start, RVU-based costing earns its keep in procedural areas, and activity-based costing belongs only where a major decision justifies the build effort.
In our engagements with health systems and multi-site groups across Rockford, Freeport, and the wider Rock River Valley, the programs that stick pair one defensible costing method with a monthly review owned by named service line leaders.
What Is Hospital Service Line Profitability Analysis?
Hospital service line profitability analysis is the practice of building a profit and loss statement for each clinical line, cardiology, orthopedics, women's health, oncology, behavioral health, so leadership can see where margin is actually created and where it is quietly consumed. Instead of one hospital-wide operating margin, you get a ranked view: which lines fund the mission, which break even, and which depend on the others to survive.
The stakes keep rising. National health expenditures reached $5.3 trillion in 2024, about 18 percent of GDP, according to the CMS National Health Expenditure fact sheet. Spending that large attracts payer pressure, and payer pressure lands unevenly across clinical lines. A hospital-wide margin that looks tolerable can hide two lines carrying six.
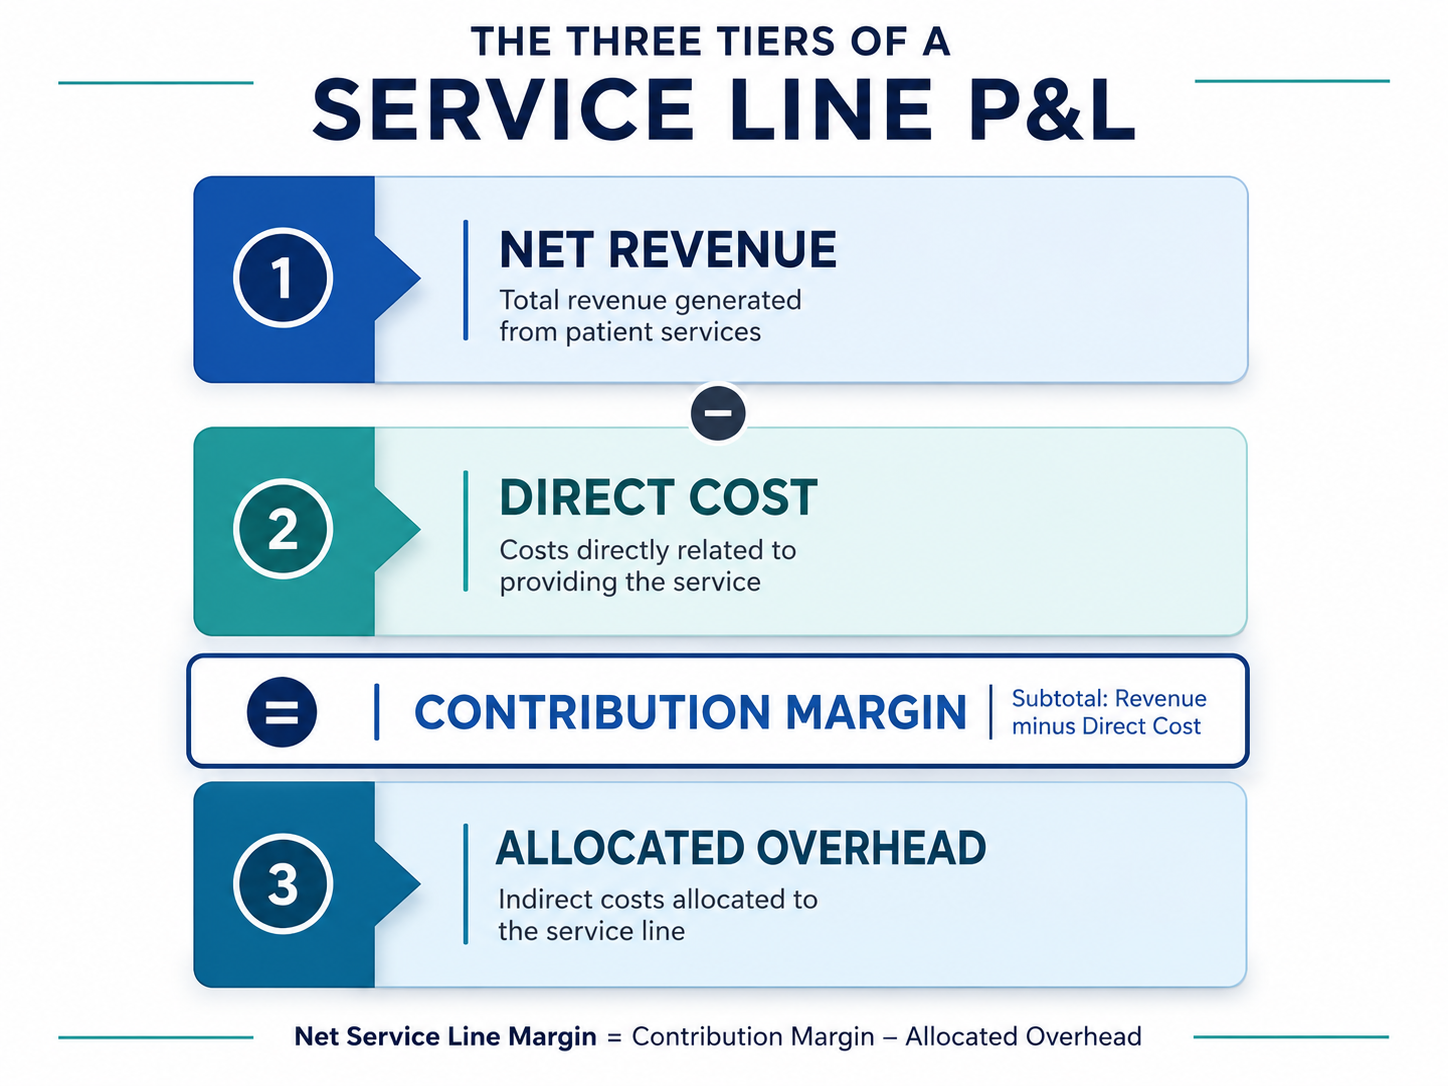
Every service line P&L has three layers: net revenue attributed to the line, direct costs the line actually incurs, and allocated overhead assigned to it by formula. Nearly every methodology argument you will ever have happens in layers two and three, which is why the rest of this article is about those layers and not about report formatting.
Contribution Margin vs Fully Allocated Margin: The Trap in the Numbers
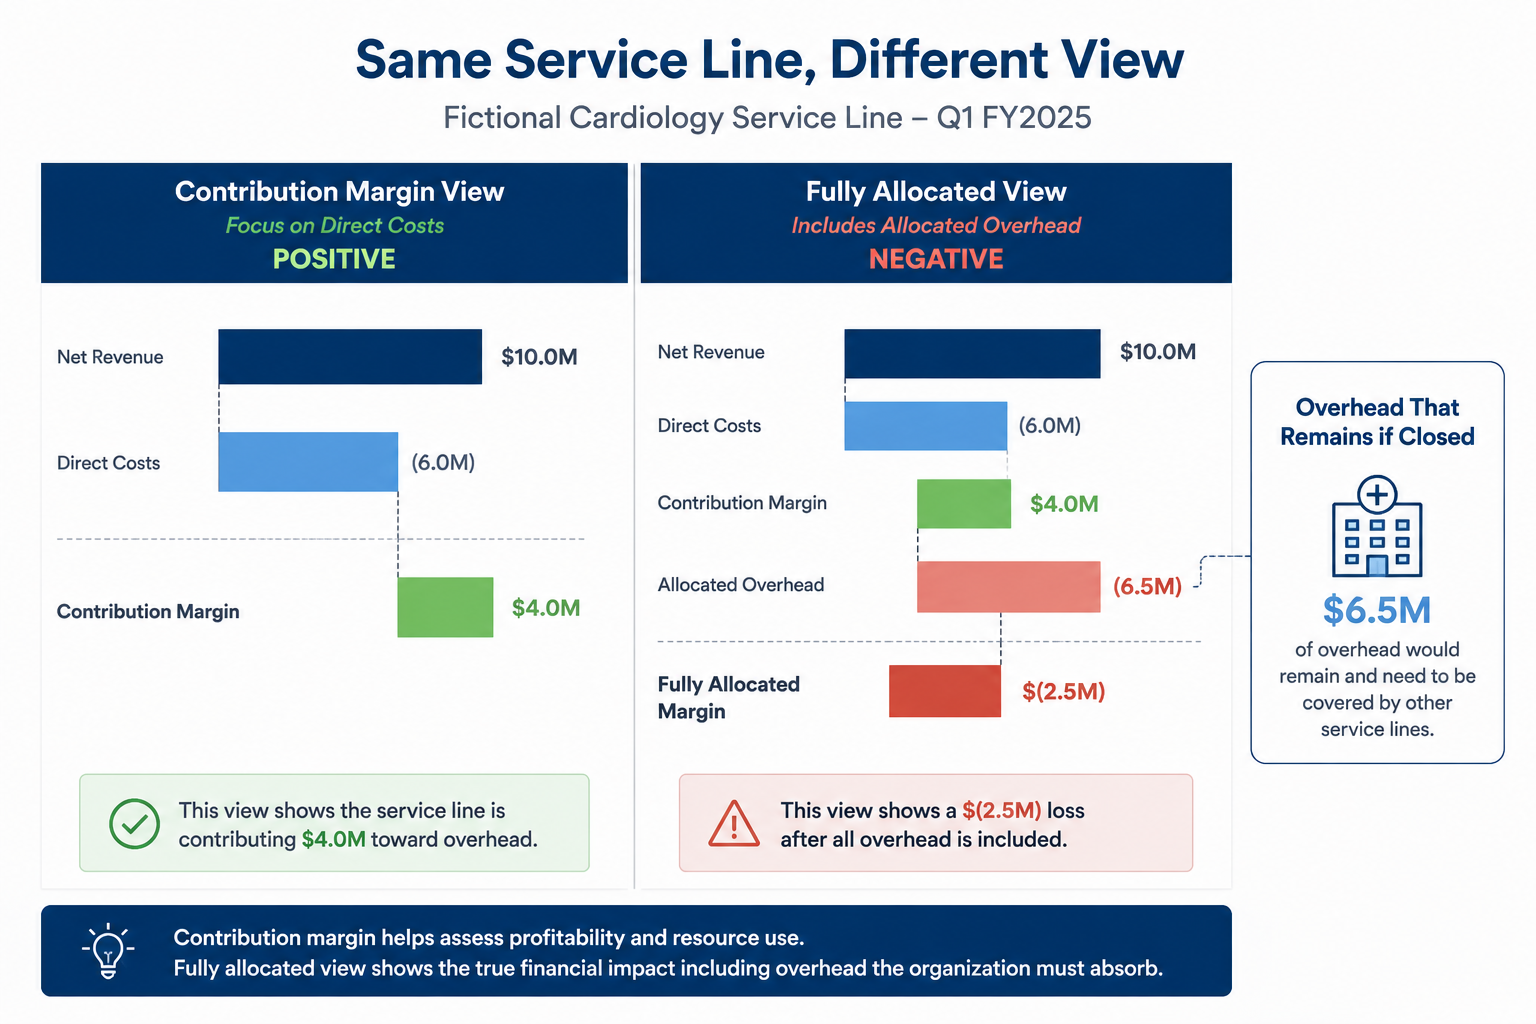
Contribution margin is net revenue minus the direct costs of running the line: the nurses, techs, supplies, implants, drugs, and physician arrangements that exist because the line exists. Fully allocated margin then subtracts a formula-driven share of everything else: administration, IT, finance, plant operations, the parking garage.
Both numbers are useful. They just answer different questions. Fully allocated margin tells you whether a line covers its share of the whole enterprise over the long run. Contribution margin tells you what actually happens to the organization's cash if the line grows, shrinks, or closes.
Here is the trap, and we have watched boards walk straight into it. A line shows a $2 million loss on a fully allocated basis, and someone proposes closing it to "save" $2 million. But if $3 million of that line's cost is allocated overhead, closing the line removes the revenue and the direct costs while most of the overhead stays in the building and gets reallocated to the surviving lines. The hospital ends up worse off, and next year a different line looks like the problem. A line with positive contribution margin and a fully allocated loss is usually a line to fix or grow, not a line to close.
This distinction matters more as margins compress. The American Hospital Association reports that hospitals cared for more and sicker patients in 2025, with inpatient volumes up 5.3 percent, while Medicare paid just 83 cents for every dollar hospitals spent caring for its beneficiaries in 2024, per the AHA Costs of Caring report. Volume growth with below-cost payment means growth alone will not rescue a weak line, and it makes line-level visibility the difference between managing margin and guessing at it.
Choosing a Costing Method: RCC, RVU, or Activity-Based
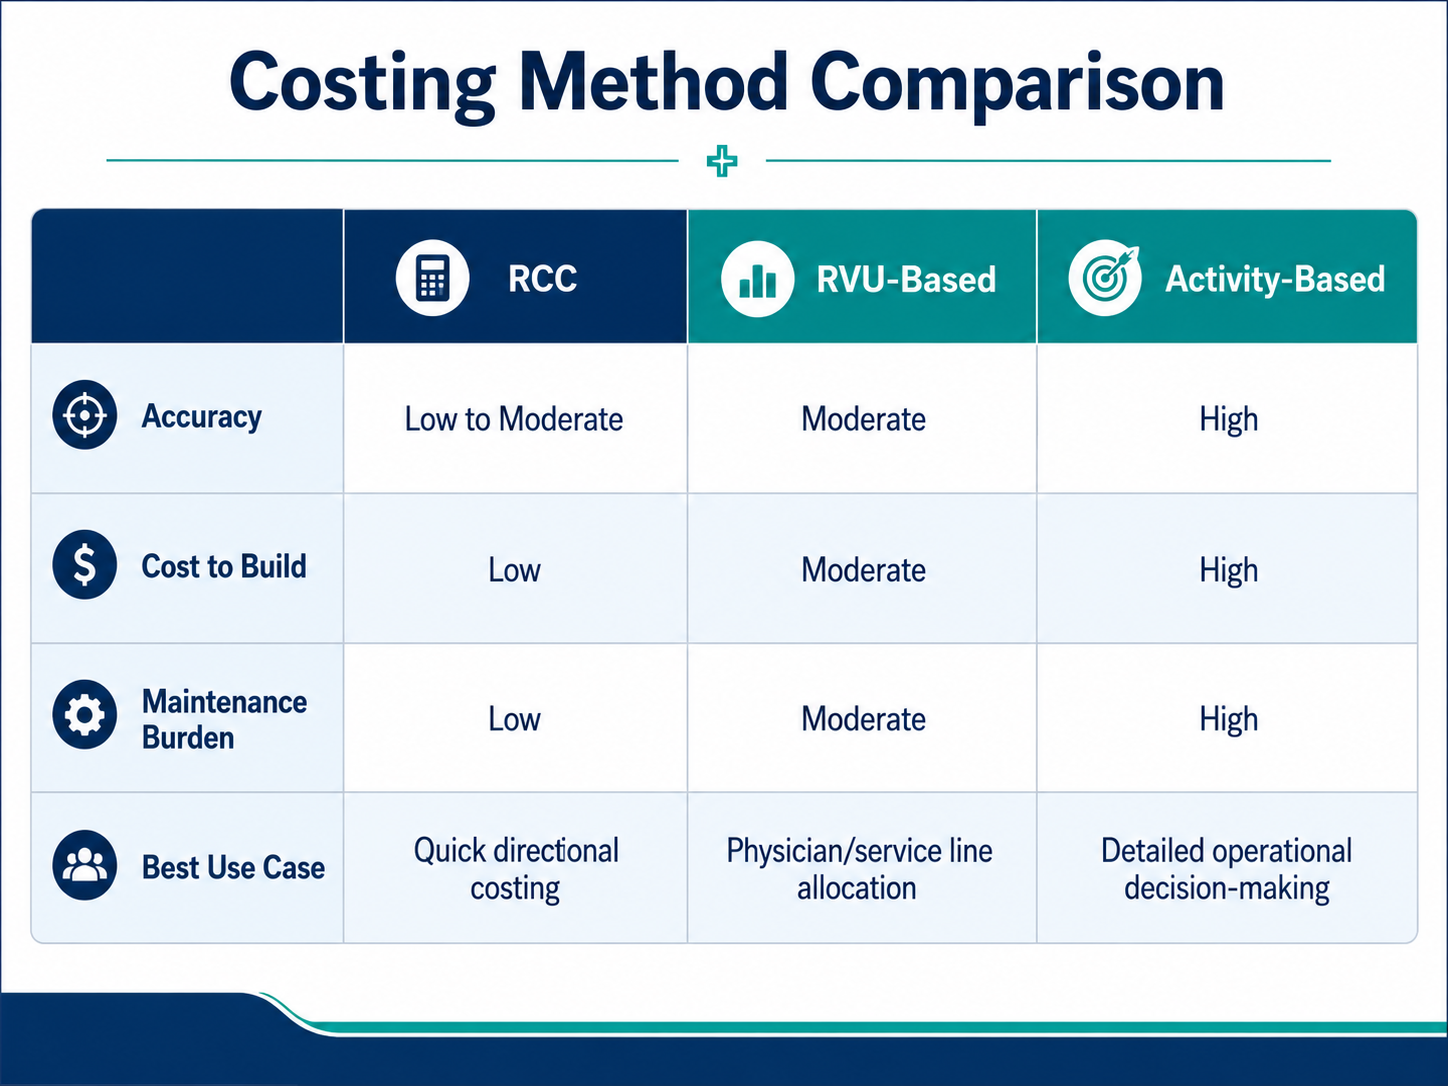
The cost side of the P&L depends entirely on how you assign cost to patients and encounters. There are three workhorse hospital cost accounting methods, and the honest answer about which to use is: the cheapest one that is accurate enough for the decision in front of you.
Ratio of cost to charges (RCC)
RCC takes each department's ratio of total cost to total charges and applies it to every charge line. It is fast, cheap, and built from data every hospital already has. Its weakness is inherited distortion: where the chargemaster does not track actual resource use, and it often does not, RCC smears cost evenly across cases that are not even. RCC is usually good enough for a first-pass ranking of service lines and for spotting the outliers worth a closer look.
RVU-based costing
RVU costing weights each procedure by the relative effort and resources it consumes, then spreads department cost across those weights. It is meaningfully more accurate in procedural areas, the OR, imaging, cath lab, laboratory, where a 30-minute case and a four-hour case should not carry the same cost. The price is maintenance: someone has to own the weights and update them as practice patterns change.
Activity-based costing
Activity-based costing (including time-driven variants) traces what actually happens to the patient: minutes of OR time, units of nursing care, actual implant cost. It is the most accurate method and by far the most expensive to build and maintain. Reserve it for the places where the stakes justify it, a service line expansion decision, a joint venture negotiation, a value-based contract, rather than deploying it house-wide on principle.
HFMA has published costing and managerial accounting guidance for hospital finance teams for decades, and it is the right professional home for teams standardizing their method. The rule we give clients is simple: match the precision to the decision. Do not spend a year building activity-based costing to answer a question RCC could have settled in a month.
Overhead Allocation Politics and Physician Alignment
No topic generates more conference-room heat than the allocation formulas. Should IT be allocated by device count or by headcount? Plant operations by square footage? Administration by revenue? Every basis creates winners and losers, and every service line leader can argue persuasively for the basis that flatters their line.
Three practices keep the politics survivable. First, publish the methodology in writing and keep it stable year over year; a formula that changes annually convinces everyone the numbers are negotiable. Second, present contribution margin above the allocation line so leaders see the numbers they can actually control before the numbers they cannot. Third, never present a physician with a black box. In our experience, physicians engage seriously with cost-per-case data when they can interrogate how it was built, and dismiss the entire exercise the first time an analyst cannot explain a number.
That last point is where dedicated financial leadership earns its keep. Service line profitability is as much a trust-building exercise as an accounting one, and the finance leader who walks a skeptical department chair through the methodology, line by line, buys credibility no dashboard can.
The Governance Cadence: Monthly Reviews With Named Owners
A service line P&L that gets built once and emailed quarterly changes nothing. The discipline that moves margin is a monthly service line review with a named owner, usually a physician leader and an administrator as a dyad, working from a standard package: volumes, payer mix, net revenue per case, direct cost per case, and the contribution margin trend. Decisions get logged, and last month's decisions get revisited. In our engagements, and across the 7+ system conversions behind them, the initial build typically takes 60 to 90 days; the monthly cadence is what makes the next five years pay for it. This operating rhythm, not the report itself, is the heart of any real healthcare finance transformation.
The regional case for this discipline is unusually vivid here. Rockford is a rare mid-size market with three competing hospital systems, OSF HealthCare Saint Anthony, Mercyhealth Javon Bea Hospital Riverside, and UW Health SwedishAmerican, and the consolidation wave is live: FHN in Freeport joined Mercyhealth on January 1, 2026, KSB in Dixon merged into OSF in January 2025, and Mercyhealth also operates a 196-bed hospital and trauma center in Janesville. A newly combined system has to see service line margin across sites it did not operate a year ago, on charts of accounts it did not design. For finance teams across Northern Illinois and southern Wisconsin, service line reporting for health systems is no longer an analytics luxury; it is how a merged organization figures out what it actually bought.
When Service Line Accounting Is Overkill
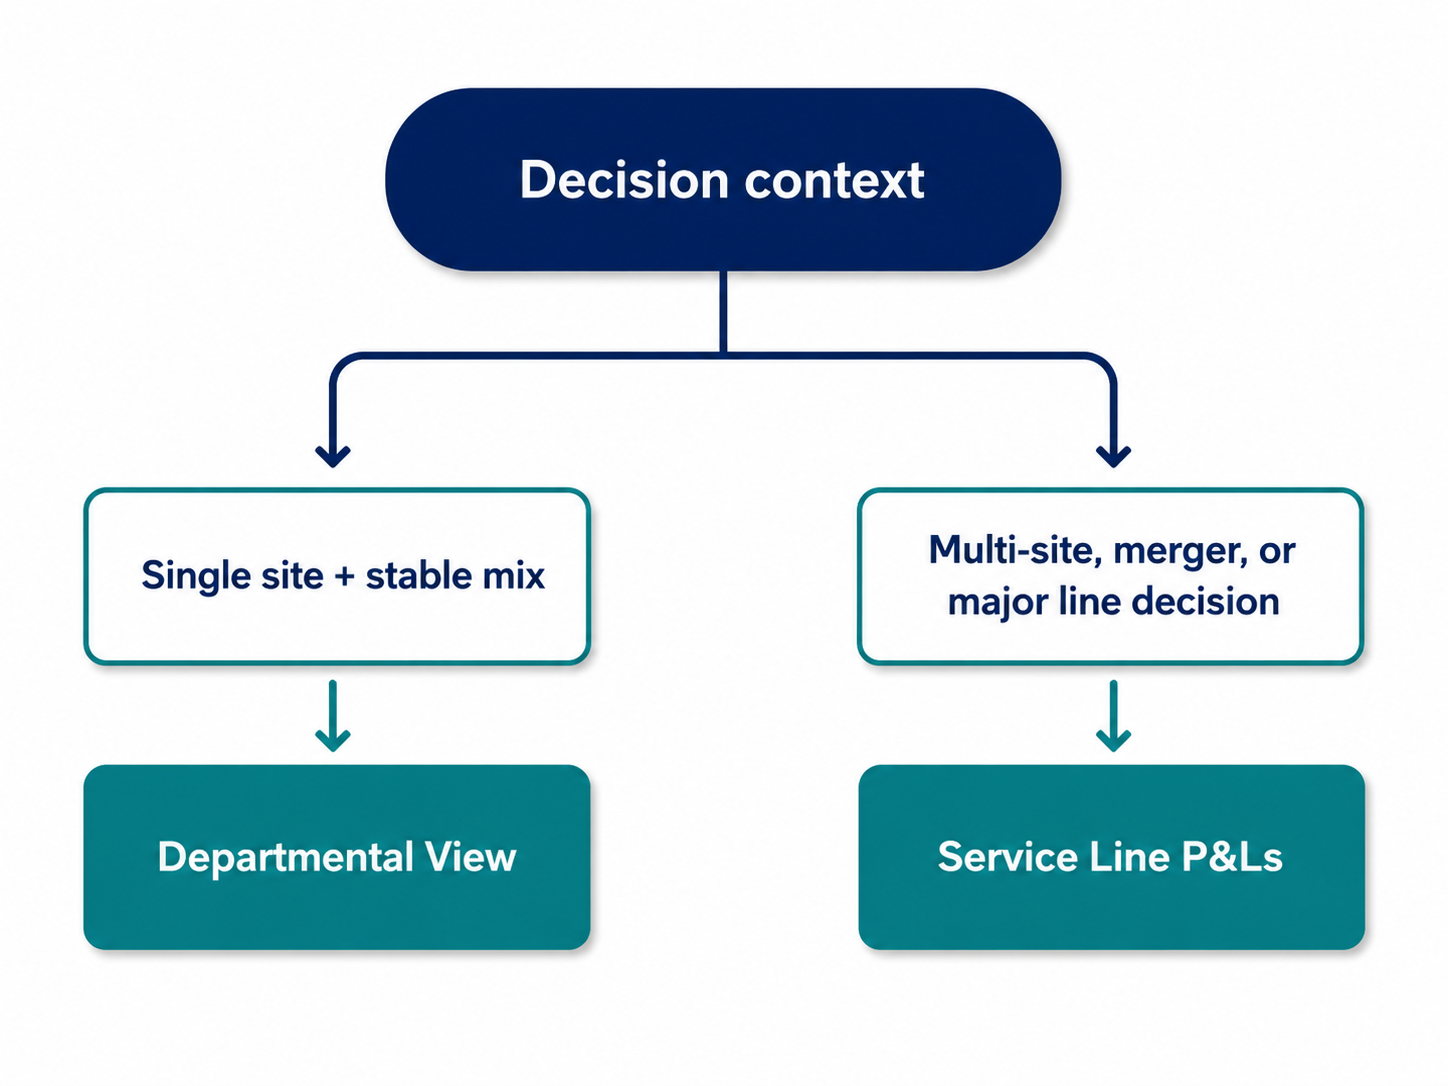
Honest trade-off time: not every hospital needs this. A single-site community hospital with a stable service mix, no expansion or closure decision pending, and a thin finance team will often get more value from a disciplined monthly departmental view plus a handful of well-chosen indicators: net revenue per adjusted patient day, labor cost per case, days in accounts receivable.
Service line accounting carries a real cost of ownership. Analyst time, data feeds from the EHR and payroll, allocation upkeep, and the meeting cadence all compete with everything else the finance office does. If the reports are not driving decisions, they are overhead of their own. We have told more than one organization in the Rock River Valley to defer the build and fix the close first; strong monthly healthcare accounting services fundamentals are the prerequisite, because service line math built on an unreliable general ledger just distributes the errors more precisely.
The trigger to graduate from a departmental view is a decision: adding a line, recruiting into one, negotiating a value-based contract, or absorbing a merged campus. When a specific decision is on the table, the analysis pays for itself. When none is, simpler wins.
Final Thoughts: The Margin Is in the Method
Vendor demos make service line profitability look like a software purchase. It is not. The dashboard is the last five percent. The work is choosing a costing method that matches your decisions, drawing the contribution margin line where leaders can see what they control, writing down an allocation methodology you are willing to defend in front of a department chair, and then showing up every month to act on what the numbers say.
Get those right and the same ten service lines stop being a single blended margin and become a portfolio you can actually manage: lines to grow, lines to fix, and, occasionally and with clear eyes, a line to exit based on contribution margin math rather than allocation artifacts. That is where the margin actually is.
Serving healthcare across Northern Illinois & southern Wisconsin
Financial leadership for mid-to-large healthcare organizations across Northern Illinois
Team Consulting 360 helps multi-location medical groups, specialty networks, and health-system finance teams across Rockford, Illinois and the wider region (Loves Park, Machesney Park, Belvidere, Rockton, Roscoe, Cherry Valley, Freeport, Byron, Rochelle, DeKalb, Sycamore, Dixon, Sterling, Beloit, WI, Janesville, WI). We work throughout Winnebago, Boone, Ogle, Stephenson, DeKalb, and Lee counties, the Rock River Valley, and the southern-Wisconsin Stateline market. Growing healthcare organizations across Northern Illinois face the same payer complexity, denial pressure, and multi-site reporting challenges as big-city systems, usually with leaner finance teams, which is exactly where clean, scalable, consolidated financial systems pay off fastest.
Healthcare organizations we work with
- Mid-to-large: Multi-location medical groups, specialty networks, ambulatory and health-system finance teams
- Growing: Group practices, clinics, and mid-market organizations scaling across locations
- Smaller: Single-location practices and businesses building their financial foundation
Ready to move forward?
Let's build financial systems your team can trust
Book a free, no-pressure clarity call with Team Consulting 360, or grab our free finance-transformation guide. We'll help you see where your reporting, cash flow, and financial systems stand today, and map the fastest path to clean numbers and confident decisions.
Free 30-minute call · No obligation · Real answers
Frequently Asked Questions
What is hospital service line profitability analysis?
How do hospitals do cost accounting?
What is the difference between RCC and RVU costing?
Should a hospital close a service line that loses money?
How often should service line P&Ls be reviewed?